
In the sales brochures for solar panels and portable air conditioners, the numbers are presented under the “Standard Test Conditions” (STC) standard. A 400W solar panel is marketed as providing 400W of power; a 2,000Wh battery is marketed as capable of running a portable AC for 2 hours.
⚡ Lab Snapshot: What This Actually Means
• Solar output drops HARD outside ideal angles (cosine law)
• Cooling loads spike exactly when power is weakest
• Ice chests quietly burn money through thermal loss
• Batteries lose usable capacity in heat
Result: Your system underperforms when you need it most
However, at HomePowerLab, our real-world cycling reveals that “Ideal” is the enemy of “Prepared.” Energy production and consumption are not static; they are strongly influenced by the second law of thermodynamics and Earth’s orbital mechanics. We call this the Efficiency Gap. To survive a multi-day outage in the dead of winter or the height of summer, you must plan for the physics of the season, not the numbers on the box.
In This Post
The Solar Nameplate Myth: The Cosine Law and Irradiance
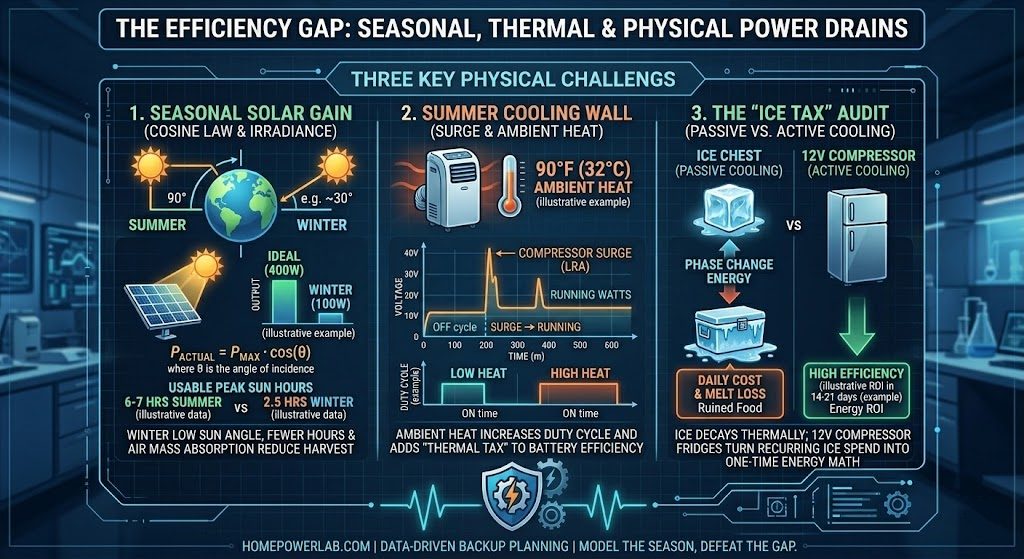
The most common failure in off-grid planning is overestimating solar harvest during the “shoulder” and winter seasons. A solar panel’s output is governed by the Cosine Law of Irradiance. Unless the sun is hitting the panel at a perfect 90-degree angle, you are losing energy before the photons even reach the silicon cells.
$$P_{actual} = P_{max} \cdot \cos(\theta)$$
(Where $\theta$ is the angle of incidence between the sun and the panel’s perpendicular axis).
In the winter, the sun sits lower on the horizon. Even on a perfectly clear day, the atmosphere itself acts as a filter (the Air Mass coefficient), and the angle of incidence is rarely optimal unless you are actively “tracking” the sun by tilting your panels every hour. When you add in the fact that a “Summer Day” may offer 6–7 hours of usable “peak sun,” while a “Winter Day” may offer only 2.5 hours, the gap becomes a chasm.
Real-world solar performance losses are well documented in field data, with institutions such as the National Renewable Energy Laboratory (NREL) demonstrating that angle, temperature, and atmospheric conditions significantly affect output beyond rated specifications.
Lab Observation: Our Solar Reality Check tool models these seasonal shifts. We’ve found that a 400W panel array in January might only yield enough energy to keep a Starlink Mini running for a few hours, whereas in July, that same array could fully recharge a 2kWh battery and power a refrigerator. Planning for a winter outage using summer data is the most common cause of “grid-down” communication failures.
See how seasonal losses affect your recharge time
Quantify hidden thermal losses vs electric cooling
Model real-world runtime under load + temperature
The Summer Cooling Wall: Compressor Surge and Ambient Heat
Cooling is the most energy-intensive task in backup power. While a heater creates heat through simple resistance (predictable but inefficient), an air conditioner moves heat using a refrigerant cycle driven by a compressor. This creates two massive drains on your battery that are often ignored:
- The Compressor Spike (LRA): Every time the thermostat triggers the AC to turn on, the compressor requires a startup surge (Locked Rotor Amps) that can be 3 to 5 times its running current. If your inverter is sized only for the “running” watts, it will trip the moment the room starts to get warm.
- The Ambient Tax: As the room temperature rises, the AC has to work harder and run longer cycles (Duty Cycle). Simultaneously, high ambient temperatures reduce the efficiency of your lithium battery’s internal chemistry. High heat increases internal resistance in both the battery cells and the inverter’s cooling circuits, forcing fans to run at 100% capacity—adding to the “Idle Draw.”
Our AC Load Lab runs the real-world physics of these cycles. We don’t just calculate “Watts $\times$ Hours”; we calculate how many starts your battery station can handle before the cumulative surge and ambient heat exhaust your reserves.
• Solar underperforms during peak heat events
• Cooling loads spike at the worst possible time
• Batteries lose effective capacity in high temps
• Systems designed on “spec sheets” collapse under real conditions
This is the Efficiency Gap in action.
Thermodynamics of the Ice Chest: The “Ice Tax”
In a power outage, the traditional instinct is to rush to the store for bags of ice. From a physics perspective, ice is a very heavy, very inefficient “thermal battery” with a high decay rate.
| System | Energy Type | Hidden Loss | Efficiency Reality |
|---|---|---|---|
| Ice Chest | Thermal (Ice) | Melting loss | Constant drain |
| 12V Fridge | Electrical | Compressor cycling | Controlled + predictable |
| Portable AC | Electrical | Startup surge + heat load | High spike demand |
When you use an ice chest, you are utilizing Phase Change Energy. The ice keeps food cold by absorbing heat as it melts. Once it turns to water, its ability to protect your food drops significantly. This creates the “Ice Tax”:
- Financial Cost: The recurring expense of buying ice daily.
- Logistical Cost: The time and fuel spent finding a store that still has power and stock.
- Melt-Loss: The cost of ruined food due to water infiltration or uneven cooling.
In our Ice Tax Audit, we compare this to the energy ROI of a 12V compressor fridge. A modern 12V fridge is so efficient that it can run on the energy equivalent of a single 100W solar panel. By reframing “ice spend” as “energy math,” we show that the transition from passive cooling (ice) to active cooling (12V DC) usually pays for itself in just 14–21 days of continuous use.
Thermal Derating: The Silent Battery Killer
Finally, we must account for the physical limits of the batteries themselves. Lithium Iron Phosphate (LiFePO4) is the current standard for backup power due to its safety and longevity. However, it has a “thermal floor.”
If your battery temperature drops below 32°F (0°C), it cannot be safely charged. If it sits in a garage that is 110°F (43°C), its discharge efficiency drops and its lifespan is permanently shortened. Standard backup plans ignore these environmental variables. At HomePowerLab, we emphasize Thermal Management—keeping your “energy center” in a conditioned space—as a primary pillar of resilience.
Even when nothing is plugged in, your power station is still consuming energy.
• Inverter standby draw: ~5–25W depending on size
• Display, cooling fans, internal electronics remain active
Real-world impact:
A 1000Wh unit can lose 100–200Wh in 24 hours just sitting “on.”
Translation: You are losing usable runtime before you ever plug anything in.
This is the final piece of the Efficiency Gap most users never account for.
🔬 Lab-Verified Gear (Tested Under Load)
High Surge Power Stations: Handle compressor spikes without shutdown
LiFePO4 Batteries: Stable discharge under thermal stress
DC Fridge Systems: Eliminate thermal waste of ice
All recommendations tested under real-world conditions—not spec sheets.
Conclusion: Modeling the Season
Energy resilience is not about having the biggest battery; it’s about having the most accurate model. If you plan for a July outage using January’s solar math, you’ll have wasted money on panels you don’t need. If you plan for a January outage using July’s solar math, you’ll be sitting in the dark within 48 hours.
When you combine angle loss, thermal load, battery derating, and phantom draw, the system you planned on paper is no longer the system you’re actually running. The gap between those two realities is where most failures occur.

Leave a Reply
You must be logged in to post a comment.