
Project: Solar Reality Check Simulator (v6.0 RC)
Subject: Methodology & Engineering Logic
Date: December 10, 2025
The Physics of Disappointment: Why We Built the Solar Reality Check
Solar marketing loves showing you perfect lab numbers. Your roof, latitude, and weather do not care. The Solar Reality Check takes your location and system design, runs it through real-world physics, and shows you what your panels can actually deliver month by month – not just the fantasy kWh on the box.
This Page Shows You
- Why your array will never hit its “rated” wattage outside of a lab.
- Where winter quietly steals 40–70% of your energy budget.
- How inverter and charge-controller losses eat into every kWh you think you have.
- Why batteries feel smaller than the sticker suggests once you factor in depth-of-discharge and inefficiency.
Use the simulator on this page to stress-test your dream system before you spend real money. The goal isn’t to talk you out of solar – it’s to kill the optimism bias that makes systems underperform in the real world.
The Solar Reality Check uses your location, tilt, and hardware to estimate real monthly output – not marketing numbers.
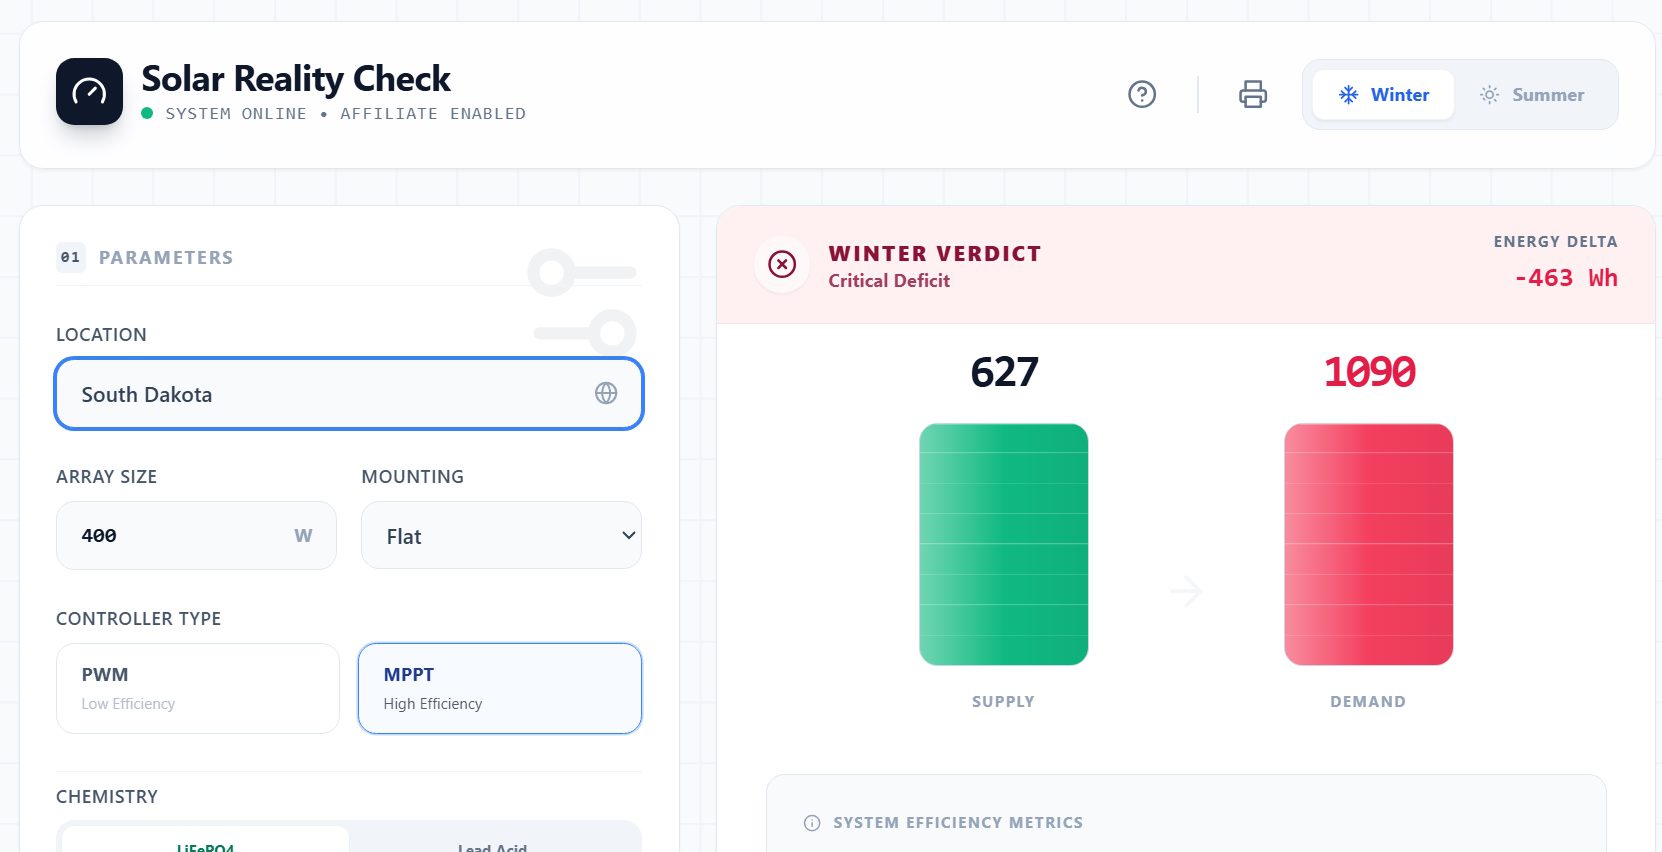
⚡ Phase 1: Run The Reality Check. Input your location and appliances below to see the gap between marketing hype and real-world physics. Once you have your results, scroll down to read the engineering logic behind why most systems fail in winter.
The 5 Reality Checks That Break Most Solar Dreams
These are the failure modes we see over and over when homeowners and DIYers size systems using only nameplate wattage and “average sun hours.” Each card below is a physics problem pretending to be an optimism problem.
Reality Check #1
The Winter Deficit (“December Crash”)
Your array might look proud and powerful on a sunny June afternoon. In December, the sun is lower, days are shorter, and your panel angle is wrong. We routinely see 40–70% less energy in winter vs. summer at the same location.
- Shorter days = fewer watt-hours, even if peak watts stay similar.
- Low sun angle drives up reflection and shading losses.
- If you sized your system on “average kWh,” winter will be the season that breaks it.
Reality Check #2
The Hidden Efficiency Tax
Every conversion step takes a bite: panel voltage to battery voltage, charge controller losses, inverter losses, wiring, heat. On paper you bought 100% of your watts. At the outlet, getting 70–80% is a good day.
- PWM controllers waste panel voltage headroom as heat.
- Inverters rarely exceed 90–93% efficiency at realistic loads.
- Undersized wire quietly turns watts into warm copper instead of useful work.
Reality Check #3
The Fantasy of “Full Rated Output”
Panel ratings are done under Standard Test Conditions: cool cell temps, perfect sun angle, clean glass, no wind shading. In the real world, hot panels run less efficiently and rarely see perfect irradiance.
- Expect peak output closer to 70–85% of nameplate on a good day.
- Dust, pollen, tilt, and partial shade all stack together.
- The simulator uses realistic derate factors, not the brochure fantasy line.
Reality Check #4
The Battery Capacity Mirage
A “5 kWh” battery bank is only 5 kWh if you fully drain it in a lab, which you should never do in real life. Depth-of-discharge limits, chemistry, and inverter losses can reduce usable energy by 30–50%.
- Lead-acid is usually happiest at 50% usable capacity.
- LFP can go deeper, but you still lose energy in charge/discharge and conversion.
- The Reality Check uses usable kWh, not mythical sticker kWh.
The Optimism Bias in Off-Grid Energy
In the renewable energy industry, there is a metric we quietly refer to as “Datasheet Optimism.” It’s the gap between what a manufacturer says a solar panel can do under laboratory Standard Test Conditions (STC) and what that panel actually produces when bolted to the roof of a van in a muddy field in Oregon.
Most online solar calculators feed this bias. They ask for your location and panel wattage, multiply the two by a generous average, and tell you that you’re fine. They are wrong.
We built the Solar Reality Check to be a pessimism engine. It doesn’t tell you what your system could do on a perfect July afternoon; it simulates what your system will do when the physics of the real world start eating away at your power budget.
Here is the engineering logic running under the hood of this tool.
1. The Winter Deficit (The “December Crash”)
The single most critical variable in off-grid sizing is Seasonality. A 400-watt array in Arizona might harvest 2,800 Watt-hours (Wh) daily in July. That same array, in the same location, might struggle to hit 1,200 Wh in December.
The tool’s “Winter” toggle isn’t just a UI filter; it swaps the underlying meteorological dataset from peak-summer irradiance to the winter-solstice baseline.
If you are building a system for year-round living (Van Life, Cabin, etc.), sizing for the summer average guarantees failure in winter. The tool defaults to showing you the “Critical Deficit”—the moment where your base load (fridge, lights, fan) exceeds your generation, forcing you to drain your battery bank with no hope of full recharge the next day. This is the spiral that kills batteries.
2. The Hidden Efficiency Taxes
Beginners often assume power helps them 1-for-1. If they have a 100W load and a 100W panel, they assume balance. The simulator applies three specific “taxes” that are often ignored until it’s too late.
The Tilt Penalty (Lambert’s Cosine Law)
Solar panels produce maximum power when the sun hits them at a 90-degree angle. On a vehicle or RV, panels are almost always mounted flat.
- Summer: The sun is high; the penalty is minimal (~10-15%).
- Winter: The sun is low on the horizon. On a flat mount, the angle of incidence is shallow, causing a massive percentage of photons to reflect off the glass rather than energize the cells.
- The Logic: When you select “Flat” mounting in the tool during a Winter simulation, the algorithm applies a heavy derating factor (up to 60% loss depending on latitude) to account for this geometric reality.
The Controller Tax (PWM vs. MPPT)
This is the most common mistake in budget builds. The tool includes a toggle for the Charge Controller type because the efficiency gap is massive.
- PWM (Pulse Width Modulation): Simply clips the panel voltage down to battery voltage. If your panel runs at 18V but your battery is at 13V, a PWM controller essentially throws away the extra 5V. The tool calculates this as a roughly 25% hard loss on generation.
- MPPT (Maximum Power Point Tracking): DC-to-DC conversion that trades excess voltage for amperage. The tool calculates this at 98% efficiency.
- The Result: Users can instantly see that upgrading to an MPPT controller is often cheaper than buying more panels to cover the PWM losses.
The Inverter “Idle Tax”
Running AC appliances (Starlink, Laptops, Microwaves) requires an inverter. Inverters are not 100% efficient.
- The tool applies an 85% efficiency factor to all AC loads.
- If your Starlink draws 50W, the system extracts ~59W from the battery. Over 24 hours, that “small” 9W gap equals 216Wh—enough to drain a small battery entirely on its own.
3. Battery Chemistry: The Usable Capacity Trap
A 100Ah battery is not always a 100Ah battery. The simulator forces the user to confront the chemistry of energy storage.
Lead Acid / AGM: These chemistries suffer from the Peukert Effect and voltage sag, but more importantly, their lifespan is decimated if discharged below 50%.
- The Logic: If the user selects “Lead Acid,” the tool’s recommendation engine doubles the required capacity. To get 100Ah of usable energy, you must buy and haul 200Ah of Lead.
Lithium Iron Phosphate (LiFePO4): These maintain stable voltage and can be safely discharged to 100% (though 80-90% is conservative best practice).
- The Logic: The tool treats this as a near-1:1 ratio, showing the user that while Lithium is more expensive upfront, its density and usable capacity often make it cheaper per usable Watt-hour.
4. Autonomy: The “Storm Buffer”
Finally, the tool addresses the “Days of Autonomy” variable. Solar doesn’t work at night, and it barely works during a heavy storm.
If your daily consumption is 1,000Wh and you have exactly 1,000Wh of battery, a single cloudy day means you go dark. The slider in the tool allows users to set a safety margin (1 to 7 days).
- Weekend Warrior (1-2 days): Risks power loss, acceptable for recreational use.
- Cabin/Critical (3+ days): Required for reliability.
The tool calculates the required battery bank size using this multiplier, illustrating how quickly battery costs balloon when you demand 100% uptime in bad weather.
Solar Reality Check – Mini FAQ
Why doesn’t my array ever hit its full rated watts?
Panel ratings are based on lab conditions: cool cells, perfect angle, and fixed irradiance. In real life, panels run hot, your roof tilt isn’t perfect, and there’s always some dust or haze in the air. Seeing 70–85% of nameplate in the field is completely normal.
Why does winter hurt my off-grid system so much?
Winter stacks several penalties at once: shorter days, lower sun angle, more cloud cover, and often snow or rain. If you sized your system on annual averages, winter can deliver 40–70% less energy than you expected, which is why the Solar Reality Check always graphs month-by-month output.
Why doesn’t my 5 kWh battery bank feel like 5 kWh?
Battery stickers show total stored energy, not safe usable energy. Lead-acid hates being deeply discharged, so you often only have 50% of the label to play with. Lithium can go deeper, but you still lose energy in charge, discharge, and inverter conversion. The tool works with realistic usable kWh, not sticker fantasy.
Can I just oversize the panels to fix everything?
More panel helps, but only if the rest of the system can use it. Undersized charge controllers, wiring limits, and a small battery bank can all bottleneck oversized arrays. The Reality Check helps you see where the choke point really is before you throw money at the wrong component.
Is the Solar Reality Check anti-solar?
No. It’s anti-disappointment. Solar works beautifully when it’s sized against physics instead of sales brochures. This tool is designed to show you the system you actually need to build, not just the one you want to believe in.
The Verdict
This isn’t a calculator; it’s a risk assessment engine. By simulating the worst-case scenarios—flat panels, winter sun, PWM inefficiencies, and lead-acid limitations—we provide a number that is likely higher than what the user wants to see, but exactly what they need to build.
“Box Math” vs. Reality: A Quick Comparison
This is the gap between the system you think you’re building and the one physics will actually let you have. The Solar Reality Check uses the right-hand side of this table.
| Parameter | Marketing Math | Reality Check |
|---|---|---|
| Panel Output | Sum of panel watts (e.g., 4 × 400W = 1,600W) | Peak closer to 1,100–1,300W after temperature & angle losses. |
| Daily Energy | Panel watts × “sun hours” (e.g., 1,600W × 5h = 8 kWh) | Panel watts × winter-adjusted curve, wiring, controller & inverter derates. |
| Battery Capacity | Use 100% of nameplate (e.g., 5 kWh bank = 5 kWh usable) | Lead-acid: ~50% usable. LFP: 70–80% after conversion losses. |
| System Sizing | Match box watts to appliance watts with no buffer. | Size for worst-month generation, peak loads, and 20–30% headroom. |
The Solar Reality Check tool uses conservative efficiency assumptions so the system you build in your head matches the one that lands on your roof.
Stress-Test Your System With the Solar Reality Check
Don’t size your array on the back of an envelope. Plug in your location, panel count, tilt, battery bank, and inverter, then watch how your “perfect” system behaves in January instead of June.
Use the Solar Reality Check to design the array. Use the Battery Runtime Calculator to see how long that design can actually run your critical loads.