
Project: Engineering a “Digital Twin” for DIY Electrical Planning: Logic, Physics, and Code
Subject: Interactive Topology Simulation & Safety Analysis Tool
Date: January 27, 2026
Most electrical planning tools treat circuits as static math problems.
The Visual Circuit Builder models them as dynamic systems — accounting for load changes, switching states, thermal effects, and real-world constraints that calculators ignore.
Executive Summary
For decades, the standard for DIY electrical planning—whether for RV hookups, off-grid solar systems, or home backup generators—has been the static lookup table. Users reference NEC Chapter 9, Table 8, cross-reference it with a voltage drop calculator, and hope their math holds up in the real world.
The problem is that electricity is dynamic. A circuit is not a list of isolated components; it is a system where every connection affects the next. A static calculator cannot tell you that your 100ft extension cord will cause your A/C compressor to stall when the microwave turns on, nor can it visualize the thermal risks of using aluminum service cable in 100°F heat.
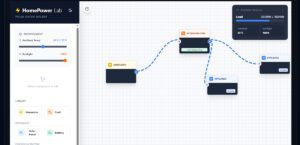
To solve this, we built the Visual Circuit Builder: a browser-based electrical topology simulator. By modeling electrical components as nodes in a directed graph, we created a “digital twin” of a physical circuit. This allows us to run real-time physics simulations that account for thermal derating, material conductivity, cumulative load analysis, and conditional logic (breakers/switches). This report details the algorithmic logic and engineering decisions behind the tool.
In This Report
The Problem: The “Static” Blindspot
Works in one configuration, fails in another. Transfer switches and branch toggles change current paths and voltage drop in ways static calculators can’t represent.
Heat increases conductor resistance, increasing voltage drop and stressing connections—especially in coiled cords, tight conduits, or hot environments.
Multiple loads on shared runs cause voltage sag that isn’t obvious when each load is calculated in isolation.
In our analysis of existing wire gauge calculators and circuit planning tools, we identified three critical failures:
- Isolation: Tools calculate voltage drop for a single run, ignoring the cumulative voltage sag caused by daisy-chained extension cords or splitters.
- Ideal Conditions: Most calculators assume an ambient temperature of $20^{\circ}C$. In reality, an RV power cord baking in the asphalt sun operates at significantly higher resistance.
- Lack of State: Static tools cannot model “what if” scenarios involving transfer switches or tripped breakers.
The Visual Circuit Builder was designed to address these by treating the circuit as a live, reactive ecosystem.
Voltage drop, resistance, and load behavior change based on topology, switching state, and temperature. Static calculators assume none of these variables move — real circuits never behave that way.
Methodology: Building the Physics Engine
The core of the application is a custom Physics Engine that runs inside a React useEffect hook, triggered by any state change (node addition, connection drag, or setting adjustment).
Graph Topology & Cycle Detection
The circuit is modeled as a Directed Graph where:
- Nodes ($V$) represent components (Generators, Cords, Appliances).
- Edges ($E$) represent the physical wiring.
Before any physics calculations are performed, the engine runs a Topological Validation Pass. Using a Depth-First Search (DFS) algorithm, we traverse the graph to detect cycles. If a user accidentally plugs an extension cord into itself (creating an infinite loop), the engine detects the recursion, halts execution, and flags a “SHORT CIRCUIT” alert. This prevents the browser from crashing due to a stack overflow and simulates the real-world behavior of a fuse blowing.
The Three-Pass Simulation Loop
Once the topology is validated, the engine executes a three-pass simulation to resolve Ohm’s Law across the network.
Pass 1: Conditional State Resolution – Unlike simple graphs, electrical circuits have gates. The engine first checks the state of Breakers and Transfer Switches.
- If a Breaker is
OPEN(Tripped/Off), the edge connecting it to the next node is logically severed. - If a Transfer Switch is set to “Input 1”, the edge from “Input 2” is ignored. This allows the user to simulate power outages and switchovers in real-time.
Pass 2: Reverse Load Aggregation (The “Ask”) Electricity is drawn, not pushed. To determine the amperage flowing through a generator, we must ask the appliances what they need. The engine performs a Reverse Traversal from the leaf nodes (Appliances) up to the root nodes (Generators).
- Algorithm: $I_{total} = \sum (Watts_{appliance} / Voltage_{node})$
- It recursively sums the current demands. This ensures that a generator node knows exactly how much load is being pulled by a fridge connected 50ft away through three different splitters.
Pass 3: Forward Voltage Propagation (The “Give”) With the current ($I$) known for every segment, the engine performs a Forward Traversal to calculate Voltage Drop.
- Base Formula: $V_{drop} = I \times R_{total}$
- The voltage at any node is $V_{parent} – V_{drop}$.
- This propagates downstream. If a generator outputs 120V, but the first cord drops 5V, the next cord starts its calculation at 115V. This “daisy-chain” accuracy is impossible with standard calculators.
| What you’re planning | Static calculator assumes | Visual Circuit Builder models |
|---|---|---|
| Transfer switch / branches | One fixed path | State-dependent paths + rerouting |
| Heat / coiled cable / hot attic | Constant resistance | Thermal derating → R↑ → Vdrop↑ |
| Multiple loads on shared run | Loads treated independently | Branch interaction + aggregation effects |
Advanced Physics & Compliance Logic
To achieve “A+++” realism, we moved beyond basic constants.
Thermal Derating & Material Science
Resistance is a function of heat. The application includes a global Environment State that modifies the resistivity of conductors based on ambient temperature using the linear temperature coefficient of resistivity formula:$$R_{T} = R_{20} \times [1 + \alpha(T – 20)]$$
Where:
- $R_{20}$ is the base resistance at $20^{\circ}C$ (derived from NEC Chapter 9).
- $\alpha$ is the temperature coefficient ($0.00393$ for Copper, $0.00403$ for Aluminum).
- $T$ is the user-defined ambient temperature.
Practical Implication: A user planning a Burning Man art installation can set the temp to $40^{\circ}C$. The app will show that a cable that is safe at room temperature is now dangerously overheating, prompting an upgrade from 14 AWG to 12 AWG.
Auto-Tripping Breakers
The Breaker Node is an active agent. It monitors the current flowing through it during every simulation tick.
- Logic:
if (Current > Rated_Limit) { status = TRIPPED; } - This introduces a feedback loop: The load calculation runs $\rightarrow$ The breaker detects overload $\rightarrow$ The breaker opens $\rightarrow$ The topology changes $\rightarrow$ The load drops to zero.
- This visually teaches users about overcurrent protection selectivity.
- Off-grid and backup power planners
- DIYers designing multi-branch circuits
- Starlink, RV, food truck, and shed builds
- Anyone tired of guessing whether a system will actually work
User Experience Architecture
The Infinite Canvas
We implemented a custom coordinate system to support Google Maps-style navigation.
- Vector Math:
Screen_Pos = (World_Pos * Zoom) + Pan_Offset - This allows the workspace to scale from a single outlet to a massive construction site power plan without losing precision. We utilize
ReactPointerEventsto unify touch (iPad) and mouse interactions seamlessly.
State Persistence & “Time Travel”
To optimize for complex planning sessions, we built a custom middleware for Zustand.
- Auto-Save: Every state change is serialized to
localStorage. A user can close the tab, return days later, and find their “Tiny Home Wiring Diagram” exactly as they left it. - Undo/Redo: We implemented a history stack that snapshots the graph state on every destructive action (delete, move, disconnect). This encourages experimentation, allowing users to “break” their circuit and hit Undo if they cause a meltdown.
Use Case Analysis
Scenario: The Food Truck
- Setup: A 12kW Generator (240V) feeding a pizza oven (4000W) and prep fridge (800W) via a 50ft cable.
- Analysis: The user initially selects a 10 AWG Copper cable. The app highlights the cord in Orange (Warning), indicating a 4.5% voltage drop.
- Optimization: The user toggles the material to Aluminum to save cost. The app immediately flags this as Red (Danger) due to Aluminum’s higher resistance. The user then upsizes to 6 AWG Aluminum. The app confirms this is safe (Green status), and the BOM (Bill of Materials) updates to show a lower estimated cost than the copper option.
Scenario: Sensitive Electronics (Starlink)
- Setup: A long run of 16 AWG extension cord powering a Starlink router.
- Analysis: While the ampacity is fine (low amps), the Voltage Drop over distance causes the voltage at the load to dip below 108V.
- Safety Alert: The appliance node turns Red with a “Motor/Electronics Risk” warning. Standard breakers wouldn’t catch this, but our simulation does, preventing potential equipment damage.
FAQ
How is the Visual Circuit Builder different from a voltage drop calculator?
Short answer: Voltage drop calculators assume a single static path. The Visual Circuit Builder models the entire circuit topology as it actually behaves.
Traditional calculators treat electrical planning as a one-time math equation. In real systems, resistance, current flow, and voltage drop change based on branching, switching states, thermal conditions, and load interaction. The Visual Circuit Builder simulates these changes dynamically using graph-based modeling rather than static formulas.
Does this tool replace NEC code compliance checks?
No — and it’s not meant to.
The Visual Circuit Builder is a planning and analysis tool, not a code inspector. It helps identify real-world failure points — such as excessive voltage drop, thermal derating issues, and improper topology — before formal NEC compliance review. Think of it as the engineering sanity check that happens before you submit or build.
Why do static calculators often underestimate voltage drop?
Because they ignore topology and state.
Most calculators assume a single load, one uninterrupted conductor, fixed resistance, constant temperature, and no switching behavior.
Real circuits rarely meet those conditions. Branching loads, transfer switches, and temperature changes alter current paths and resistance. The Visual Circuit Builder recalculates these values dynamically instead of locking them at input time.
What does “graph-based simulation” mean in plain English?
It means the circuit is treated like a map instead of a line.
Each component (generator, breaker, inverter, appliance) is a node, and each wire is a connection. The system analyzes how electricity flows through that map — including branches, loops, and switching states — using traversal algorithms rather than static equations. This allows the tool to detect problems that simple calculators physically cannot see.
Conclusion
The Visual Circuit Builder transforms the dry, mathematical constraints of electrical safety into an intuitive, visual playground. By rigorously applying graph theory, thermal physics, and NEC standards, it provides a level of insight previously reserved for professional CAD software.
It empowers homeowners, van-lifers, and DIY builders to proactively audit their power needs, moving safety from a “guess” to a “guarantee.”
Key Algorithms & Specs
- Framework: React 18 + Zustand
- Graph Traversal: Recursive DFS (Depth-First Search) for Load Aggregation.
- Coordinate System: Cartesian World Space with Affine Transformations (Pan/Zoom).
- Compliance: Alerts based on NEC recommendations (<3% Branch Voltage Drop, <5% Total Drop).
⚠️ Lab Note: This is a mathematical model for planning purposes. It is not professional electrical or medical advice. Real-world results vary based on equipment age, temperature, and usage. [Read our full Technical Disclaimer]
Visual Circuit Builder
The only online circuit diagram maker that simulates real-world physics. Map your system and instantly see voltage drop, heat risks, and battery runtime. Stop guessing, start simulating.
Price: 0.00
Operating System: web
Application Category: UtilitiesApplication