
Most solar generator reviews promise certainty: runtime charts, wattage comparisons, and neat conclusions about what will “power your home.” In practice, many of those reviews leave readers with something more dangerous than bad advice—false confidence.
Quick Summary
Most solar generator reviews repeat spec sheets and ideal tests. Real outcomes depend on surge overlap, conversion losses, temperature, and recharge bottlenecks.
Bottom Line
A “2,000 Wh / 2,000 W” unit can still fail under mixed loads. Planning improves when you model the loss stack and validate assumptions with safe home tests.
The problem is not dishonesty. It’s incompleteness. Portable power systems behave differently outside ideal conditions, and most reviews never test them under those conditions. This article explains why that gap exists, how these systems actually behave under stress, and what risk-aware testing looks like when the goal is reliability rather than reassurance.
In This Article
Solar Generator Reviews
A Quiet Failure, Not a Catastrophe
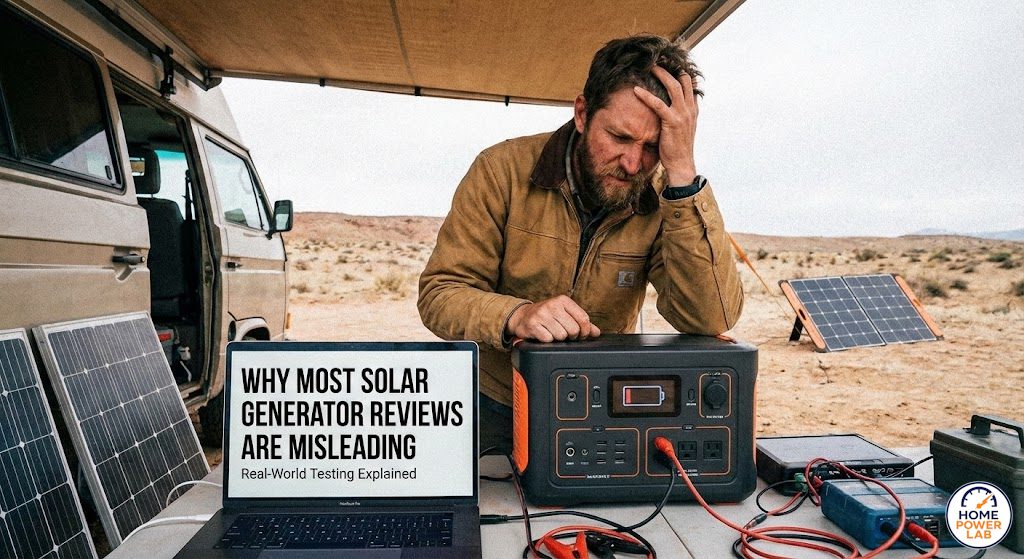
The outage starts overnight. By morning, the grid is still down. A portable power station—purchased after reading multiple positive reviews—is rolled out to keep essentials running. The refrigerator is plugged in. Phones charging. Confidence is high.
Then the microwave trips the inverter. Later, the refrigerator compressor restarts while another load is active, and the system shuts down again. Solar panels are deployed, but winter cloud cover limits input. By evening, the battery is depleted faster than expected.
Nothing “failed” in the dramatic sense. No smoke. No alarms. The system behaved exactly as designed—just not as imagined.
This is how most portable power disappointments happen, not through defects, but through mismatched expectations created by reviews that never test systems where assumptions break.
Why This Is Commonly Misunderstood
Portable power sits in an uncomfortable middle ground. It is marketed like consumer electronics, specified like industrial equipment, and used like emergency infrastructure. Reviews tend to flatten those contexts into a single story.
Three forces drive misunderstanding:
Specification bias. Reviews emphasize numbers that are easy to compare—watt-hours, inverter ratings, and advertised solar input. These figures are real, but they describe components, not outcomes.
Idealized testing. Many tests use steady, resistive loads in climate-controlled environments. Homes do not behave that way. Loads cycle. Temperatures fluctuate. Solar conditions are rarely optimal.
Economic pressure. The review ecosystem rewards speed and breadth. It is far easier to compare ten units on paper than to live with one system long enough to expose its edge cases.
The result is content that is technically accurate and practically incomplete.
Key Definitions (Plain English)
- Watt (W): How fast electricity is being used at a given moment.
- Watt-hour (Wh): How much energy a battery can deliver over time.
- Inverter: Converts battery DC power into household AC power.
- Surge power: A brief spike in demand when devices with motors or compressors start.
- Round-trip efficiency: The percentage of stored energy that actually reaches your outlets after all conversions.
- Headroom: Capacity or power margin above expected demand that absorbs variability.
These terms are often treated as interchangeable in reviews. They are not.
How the System Actually Works (End to End)
A “solar generator” is not a generator. It is a battery system with charging and conversion stages, each of which introduces constraints.
Energy input. Solar panels produce variable DC power. Output depends on sun angle, cloud density, temperature, and orientation. A panel rated at 200 W may deliver anywhere from under 50 W to 160 W, depending on conditions. Charge controllers further limit input to protect the battery.
Storage. Batteries store energy chemically. Nameplate capacity includes buffers reserved for longevity and safety. Cold temperatures reduce usable capacity and may restrict charging altogether.
Conversion. Inverters convert DC to AC. This process is never lossless. Efficiency varies with load; it is typically worse at very low and very high utilization.
Delivery. Household devices draw power unevenly. Refrigerators cycle. Microwaves surge. Multiple loads can overlap in ways that momentarily exceed inverter limits even when average consumption appears safe.
At no point does energy move cleanly from “rated capacity” to “usable power.” Every stage narrows what is actually available.
The Loss Stack Most Reviews Ignore
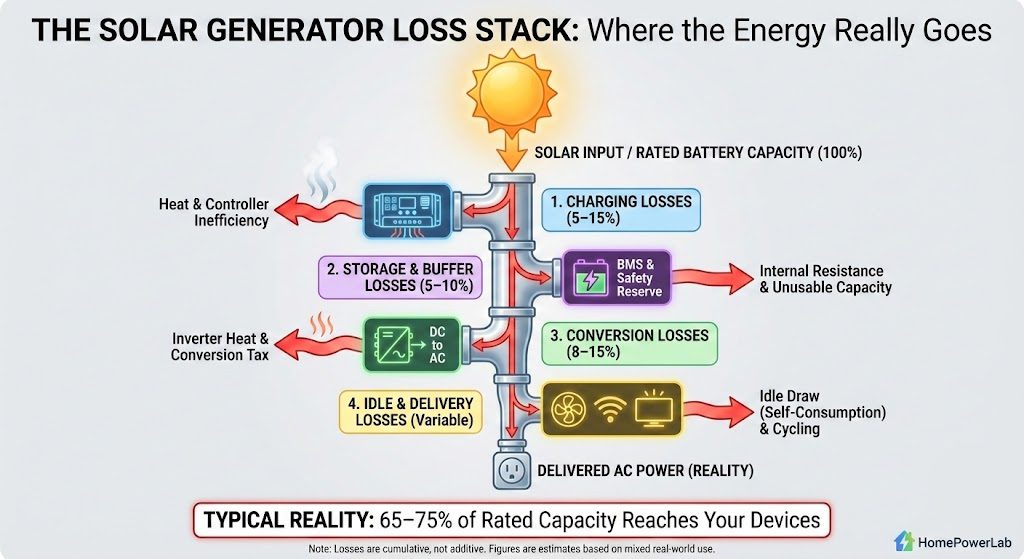
Losses are rarely additive in reviews, but they are cumulative in reality.
A realistic energy path often looks like this:
- Solar panel to charge controller: 5–15% loss
- Battery charging and storage overhead: 5–10% loss
- Battery discharge and inverter conversion: 8–15% loss
- Low-load inefficiency, cycling behavior, and idle overhead: variable
Under mixed real-world use, only 65–75% of rated battery capacity reaches AC outlets. This is not a defect. It is physics plus protective engineering.
Reviews that ignore this stack implicitly overpromise runtime.
Rated battery: 2000 Wh
AC delivered (typical mixed use): 0.65–0.75 × rated
Expected usable AC energy: 1300–1500 Wh

If load averages 150 W:
Runtime: 1300–1500 Wh ÷ 150 W ≈ 8.7–10.0 hours
Reviews that assume 100% conversion and steady loads systematically overstate runtime.
Rated vs. Real Runtime (Anonymous “2,000 Wh Class” Unit)
“Rated runtime” math: 2,000 Wh ÷ load
AC overhead assumed: 15 W while inverter is on
Real-World Conditions That Change Outcomes
Temperature. Cold reduces battery capacity and may limit charging. Heat can trigger inverter derating or shutdown. A system that performs well at room temperature may behave differently in a garage or shed.
Weather. Solar output depends on more than sunlight. Overcast skies, low winter sun angles, and snow cover can dramatically reduce input, even with adequate panel wattage.
Load variability. Appliance labels reflect average or steady-state consumption. Real devices start, stop, and overlap unpredictably.
Startup surges. Many failures occur during milliseconds-long events that reviews never measure. Surge overlap—two devices starting at the same time—is a common trigger.
Human behavior. During outages, usage patterns change. Lights stay on longer. Phones are charged more often. Small deviations compound over time.
Preparedness planning that assumes ideal behavior tends to underperform.
Failure Modes & Edge Cases (What Breaks First)
Portable power systems usually fail quietly.
Inverter protection trips. A brief surge exceeds limits, and the inverter shuts down, even though no single device appears oversized.
Solar bottlenecks. Input is capped by controller limits or panel mismatch, stretching recharge times from hours into days.
Thermal throttling. Sustained loads generate heat, reducing output or forcing shutdowns.
False runtime math. Dividing watt-hours by watts ignores cycling, losses, and overhead. Real runtimes fall short.
Battery management limits. Capacity is intentionally reserved to protect longevity. Users expecting full access to nameplate ratings are surprised.
None of these indicates failure. They indicate assumptions colliding with reality.
A Concrete Failure Example (Why Specs Aren’t Enough)
In a mixed-load test, a mid-capacity portable power station supported a refrigerator (~140 W running) while a microwave (~1,100 W) was in use. When the refrigerator compressor restarted during the microwave cycle, instantaneous demand briefly exceeded 2,400 W for under 300 milliseconds.
The inverter shut down.
Neither appliance exceeded its labeled wattage. The system’s continuous inverter rating was technically sufficient. What failed was the assumption that loads behave independently.
Most reviews never test this scenario. Homes encounter it routinely.
What Consistently Works (and Why)
Across varied conditions, certain principles hold.
Headroom reduces surprises. Systems with excess inverter capacity and battery margin trip less often and recover more gracefully.
Simplicity improves reliability. Fewer conversion steps mean fewer losses. Direct DC loads, when feasible, extend runtime.
Conservative sizing outperforms optimization. Systems designed to “just meet” expected loads fail more often than those sized with margin.
Redundancy beats precision. Multiple modest charging paths often outperform a single optimized one when conditions degrade.
Efficiency matters, but robustness matters more when conditions are uncertain.
Practical, Risk-Aware Guidance
Start with critical loads. Identify what truly must run and size for those first.
Plan for poor conditions, not peak output. Winter days and overcast skies should inform solar expectations.
Assume overlap. Appliances will start at inconvenient times. Size inverter capacity accordingly.
Test safely at home. Simulate outages. Run real loads for hours. Observe behavior. Adjust plans based on evidence.
Use calculators as framing tools, not guarantees. Runtime or solar estimators can shape expectations, but real-world validation is essential.
Preparedness improves when assumptions are tested rather than trusted.
Next: Stress-Test Your Setup with the Lab Tools
These calculators help translate specs into outcomes: recharge time under real sun, runtime under mixed loads, and planning assumptions that typically break during outages.
Solar Reality Checker
Estimate realistic recharge time by season, panel wattage, and inefficiencies that spec-sheet math ignores.
Open Solar Reality CheckerBattery Runtime Calculator
Model runtime using real loads, inverter overhead, and the “loss stack” that defines delivered energy.
Open Runtime CalculatorSurge & Overlap Checklist
Use this quick checklist to identify what’s likely to trip an inverter in your actual load mix.
Jump to Failure ModesThe HomePowerLab Perspective
HomePowerLab evaluates portable power systems as integrated systems, not isolated components. Testing emphasizes:
- Mixed-load scenarios where resistive and motor loads overlap unpredictably
- Cold-start operation in unconditioned spaces
- Extended partial-load use to observe inverter efficiency decay and thermal behavior
These conditions expose limitations that short, steady-load tests do not. The goal is not to rank products, but to reduce surprises by identifying where assumptions break.
Explicit Takeaways
- Rated battery capacity overstates delivered energy because conversion losses and protection buffers are unavoidable.
- Inverter surge handling often determines success more than continuous wattage ratings.
- Solar recharge times vary widely with season and weather, even with adequate panel wattage.
- Systems operated well below their limits behave more predictably than those sized to theoretical minimums.
- No portable battery system can replace grid power without accepting reduced load scope and variable runtime.
FAQ: Solar Generator Reviews (No Spec-Sheet Math)
Why do solar generator reviews overpromise runtime?
What matters more: watt-hours or inverter watts?
Why does solar “input rating” rarely match field charging?
How can I test my assumptions safely at home?
Conclusion: Preparedness Is Understanding, Not Accumulation
Preparedness is not about owning more equipment. It is about understanding how systems behave when conditions are imperfect and choices are constrained.
Portable power works best when its limits are acknowledged, tested, and planned around. Reviews that ignore those limits do not make systems better—they make outcomes worse.
Clarity, not confidence, is what keeps the lights on longer.

Leave a Reply
You must be logged in to post a comment.